Use point inflows to apply pollutants to a 2D mesh
Any referenced datasets can be downloaded from "Module downloads" in the module overview.
Step-by-step guide
In InfoWorks ICM, point inflows can be used to apply pollutants directly to the surface of a 2D mesh, to specify the locations where pollutants enter the network.
Note that there are similarities between applying pollutants via point inflows and applying them to manholes in pollutographs, so it may be useful to review how pollutants are applied to manholes first.
To apply a point inflow to a 2D mesh:
- From the GeoPlan Tools toolbar, expand the New object type combo box and select Point.
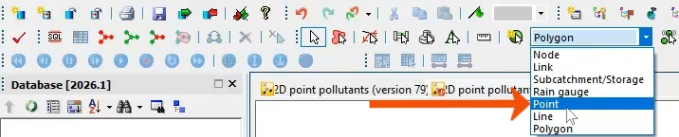
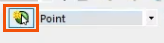
- Click Create New Object.
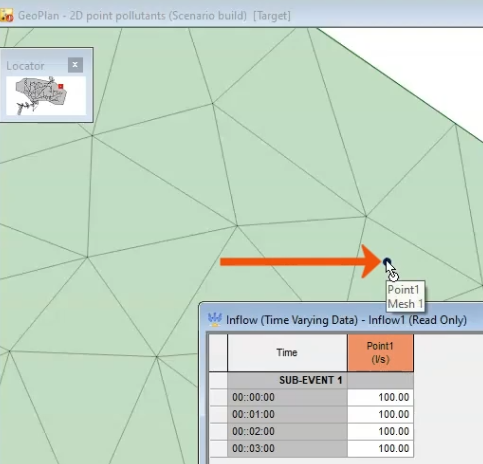
- In the GeoPlan, select a point.
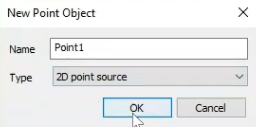
- In the New Point Object dialog box, type a Name, such as “Point1”.
- Select the appropriate Type. In this case, leave 2D point source selected and click OK.
Next, create an associated inflow. In this example, Inflow1 has already been created.
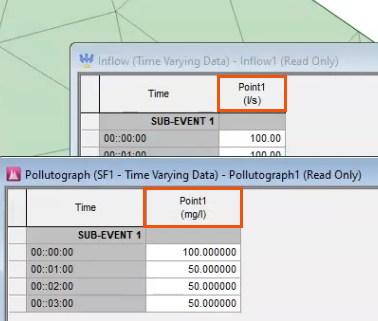
- Open Inflow1 to review the settings.
Note that the name of the inflow must match the name of the associated point.
If there are several points, append a series of profiles and assign them accordingly.
Now, apply the pollutant load to the specified point. In this case, Pollutograph1 is used and has already been created.
- Open Pollutograph1 to review the settings.
- Select the SF1 tab.
Pollutant concentrations are defined in milligrams per liter, similar to how pollutants are applied to a manhole in a pollutograph.
Again, be sure to use consistent naming for the pollutant, flow and the location on the mesh surface, as shown below.
In this pollutograph, pollutants are specified in the SF1 and BOD tabs.
- In the Run dialog, add the network, the inflow, and the pollutograph.
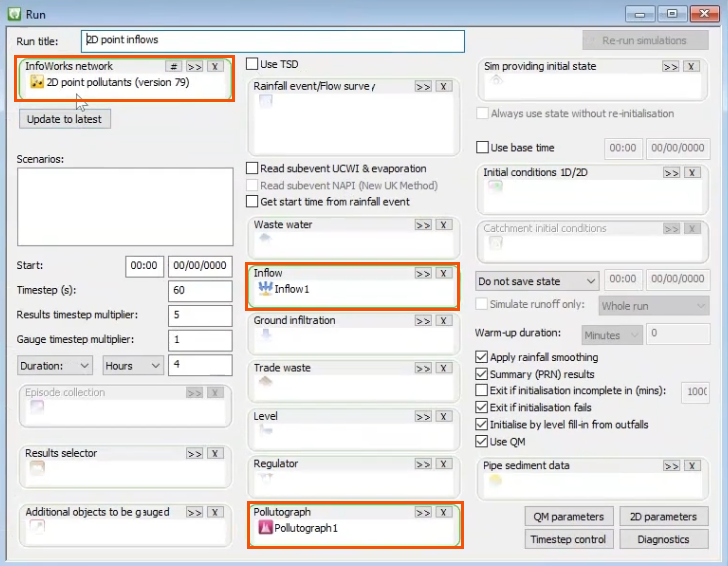
Optionally, add rainfall or other pollutant inputs as well.
- Enable Use QM.
- Click QM Parameters.
- In the QM Parameters dialog, select the pollutants BOD Dissolved and SF1.
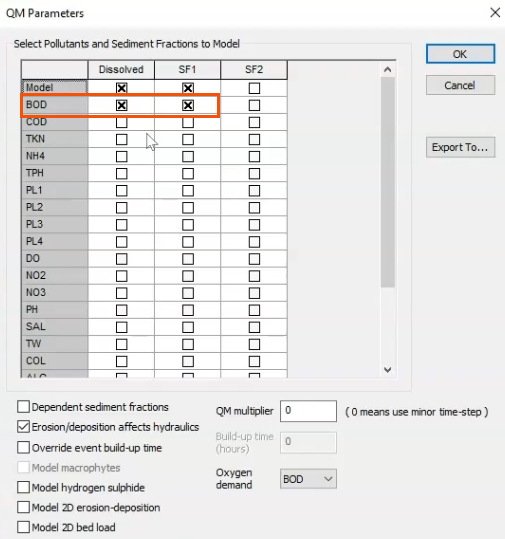
- Click OK.
- In the Run dialog, click Run simulations.
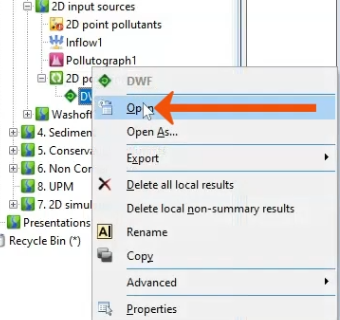
Once the simulation is complete, open and analyze the results.
- Right-click the result, DWF, and select Open.
- On the Results toolbar, click Graph.
- In the GeoPlan, select Point1.
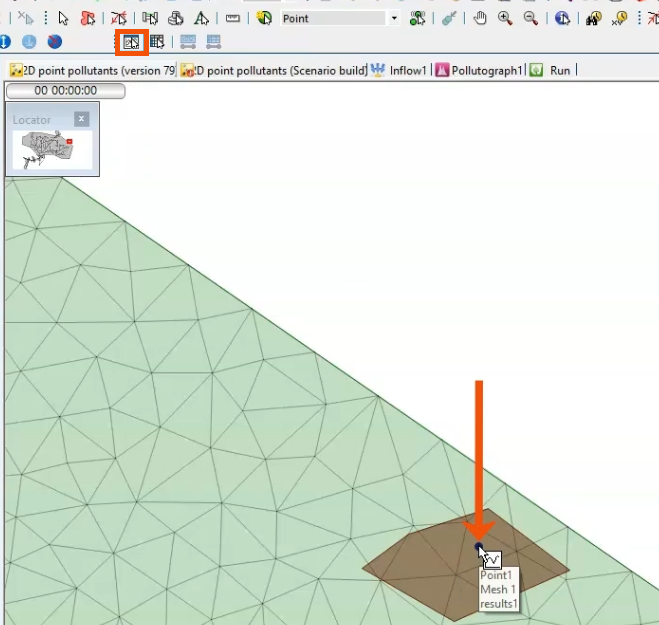
In the Graph dialog, notice that the Flow attribute is available, but there are no options to graph the associated pollutants.
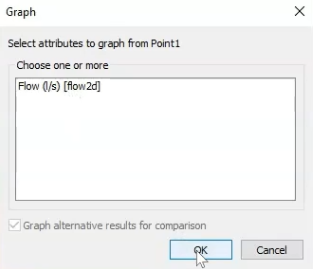
To graph the pollutant input directly, a results polygon can be used.
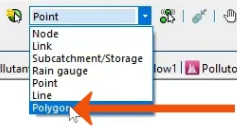
- To create a polygon, in the New object type drop-down, select Polygon.
- Digitize the boundary of the polygon and specify it as a 2D results polygon. In this example, the polygon is already created.
- Click Graph again.
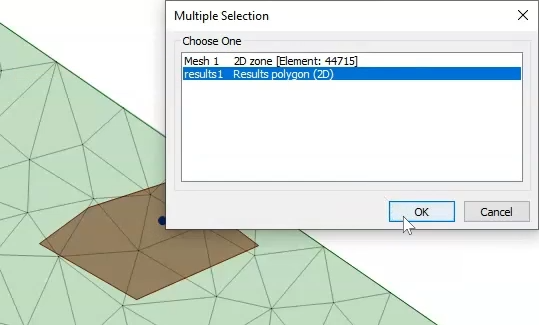
- In the GeoPlan, select the polygon.
- In the Multiple Selection dialog, select Results polygon (2D).
- Click OK.
The Graph dialog now includes the water quality parameters.
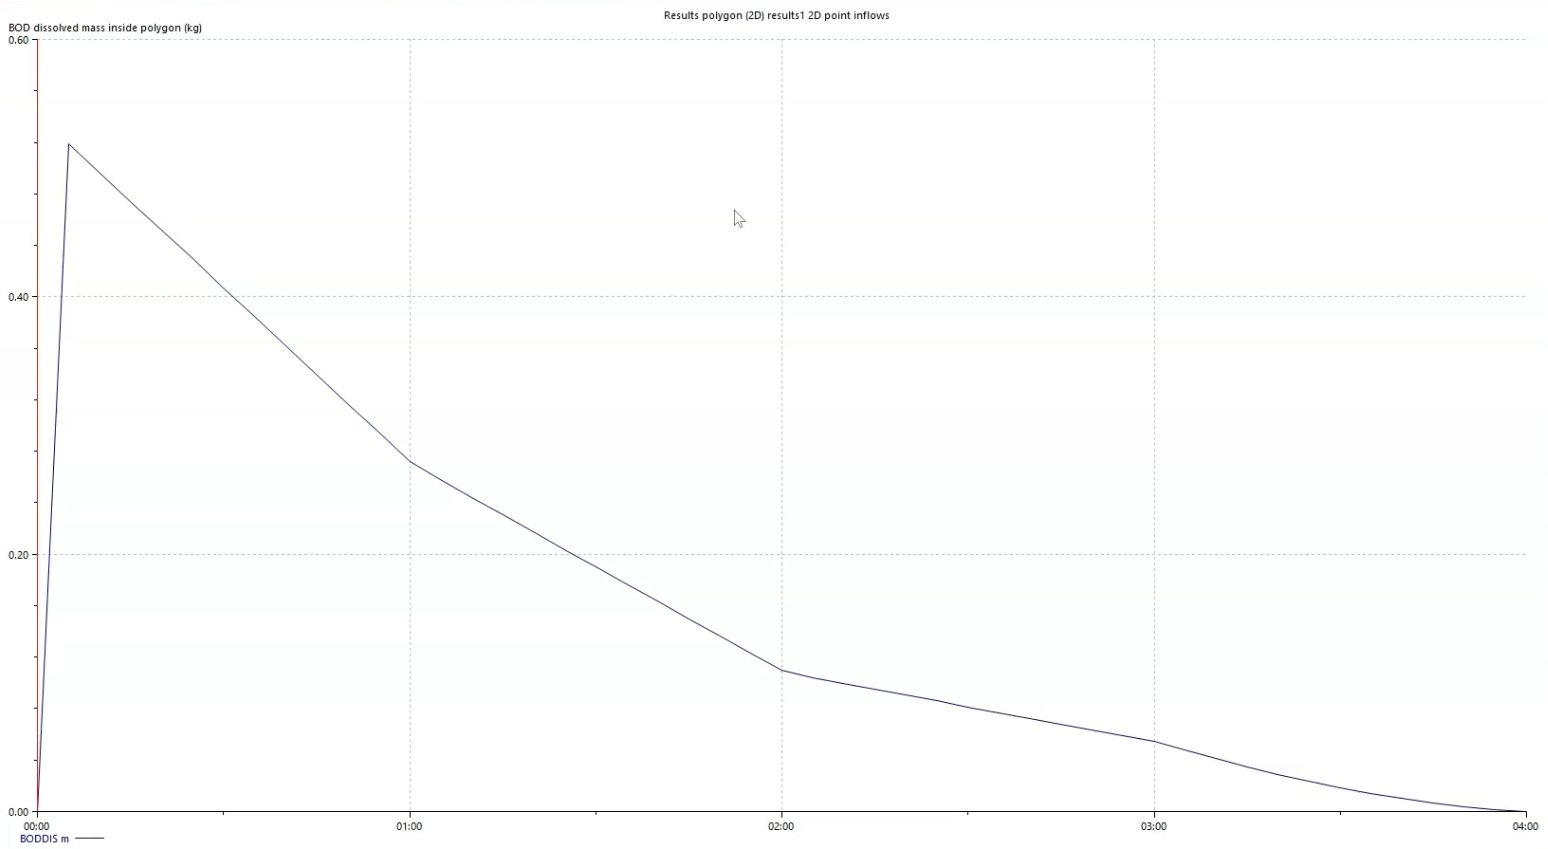
- Select BOD dissolved mass inside polygon.
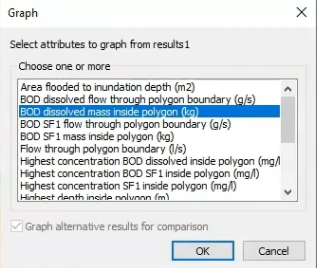
- Click OK.
The resulting plot is displayed.
The process remains the same, regardless of whether you are applying one or multiple points.