Configure a pollutograph
Any referenced datasets can be downloaded from "Module downloads" in the module overview.
Step-by-step guide
A pollutograph defines a set of water quality inputs to the system, including concentrations for sediment fractions and dissolved determinants, as well as the potency of attached determinants.
The input is applied at a particular node, link, or other 2D source using the Profile Properties dialog.
The pollutograph is used in conjunction with an Inflow or Level event, which provides flow measurement, and the two together define actual pollutant inflow.
This example model has four manholes, three pipes, and a subcatchment.
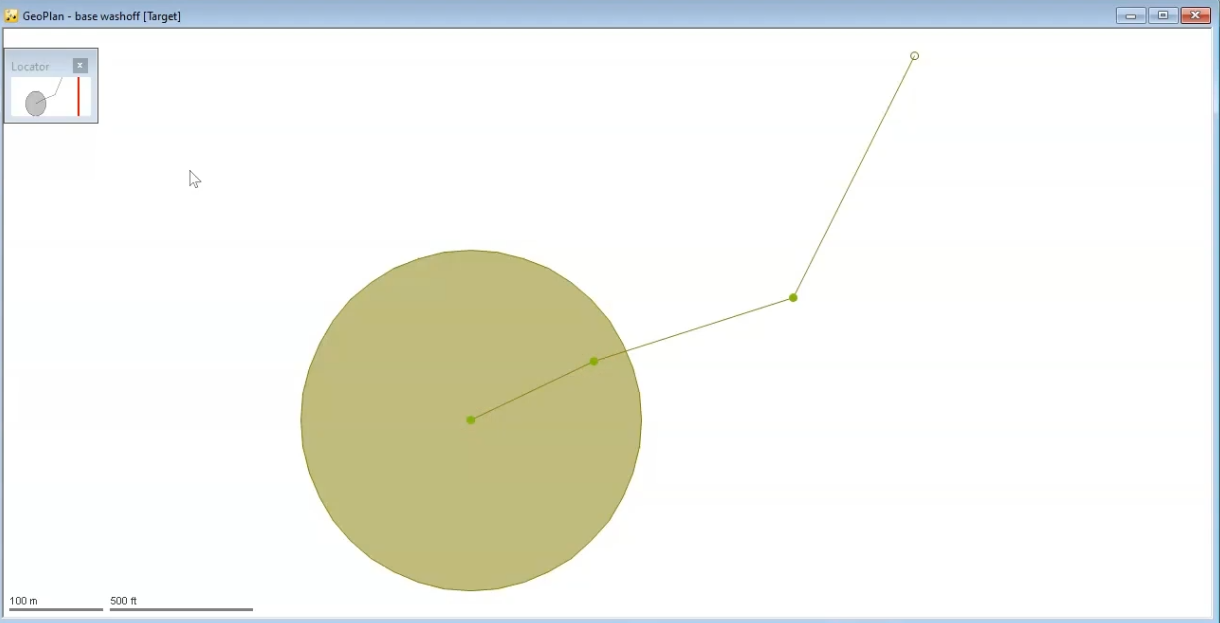
In this case, the subcatchment is irrelevant because the inflow hydrographs are assigned directly to two of the manholes, Manhole A and Manhole B.
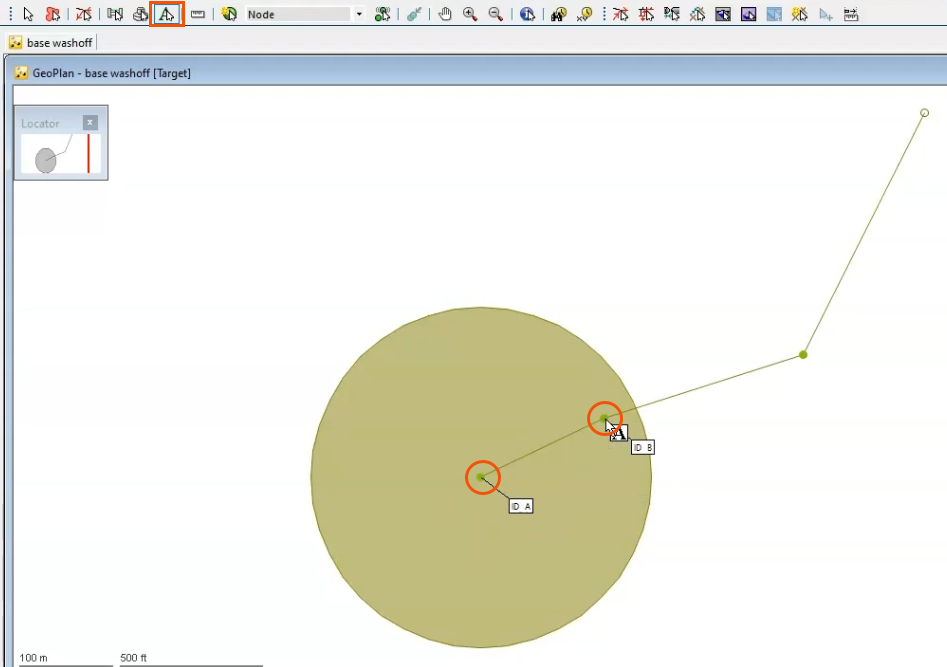
To identify these in the GeoPlan:
- From the GeoPlan Tools toolbar, click Auto Label.
- In the GeoPlan, click each Manhole to add a label.
An Inflow event and associated Pollutograph are already set up for this example.
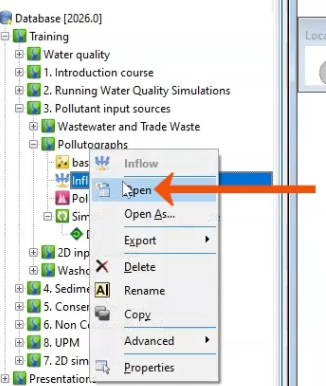
- To review the Inflow hydrograph, from the Explorer window, right-click the Inflow event and select Open.
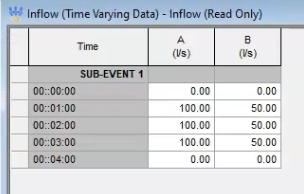
- In the Inflow dialog, note the flow against time relationship and the profiles that have been assigned to Manhole A and Manhole B.
- From the Explorer, right-click the associated Pollutograph and select Open.
The pollutograph includes tabs for individual water quality determinants, which can be assigned in time varying concentrations or potencies.
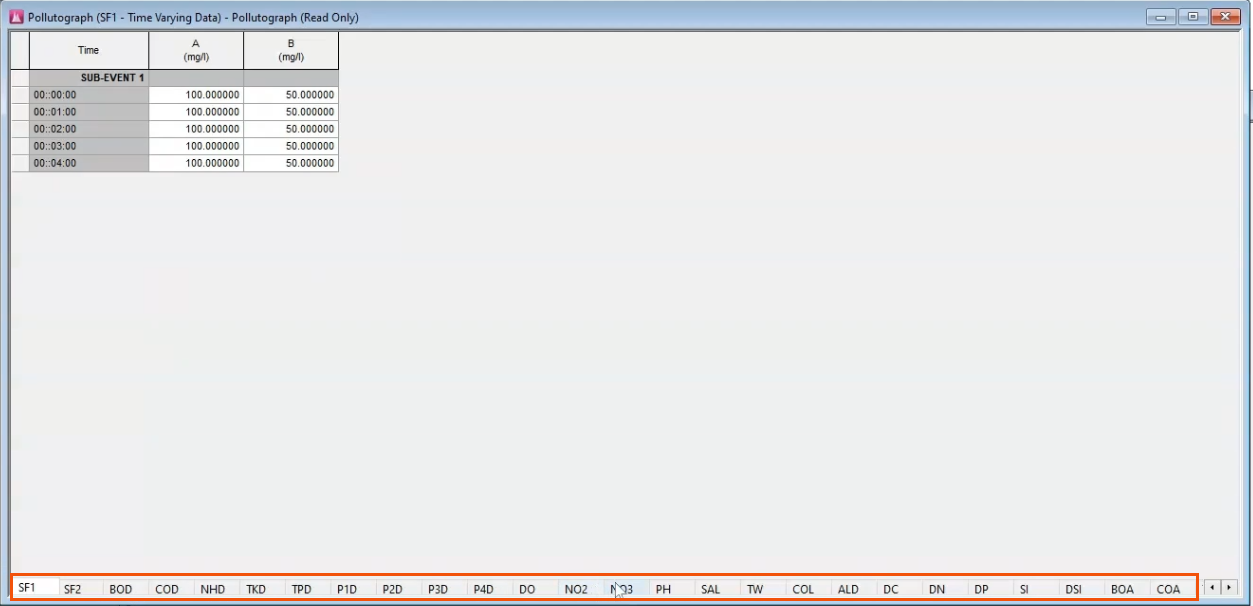
These tabs can be divided into four separate categories of determinant input: sediments, dissolved pollutants, attached pollutants, and detrital pollutants.
Sediments
Sediment Fraction 1 (SF1) and Sediment Fraction 2 (SF2) define time-varying sediment concentration.
- Select the SF1 tab to see the values assigned as a concentration in milligrams per liter.
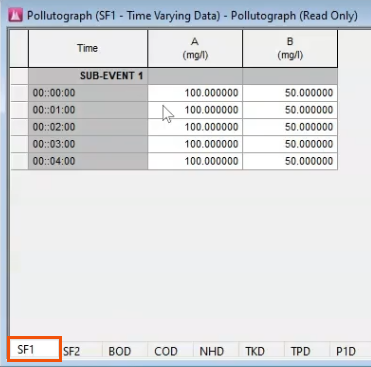
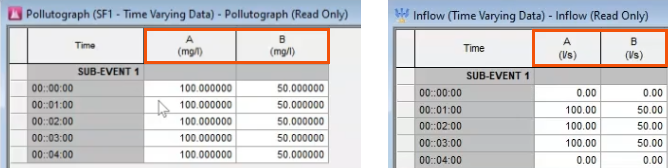
Consistently, there are 100 milligrams per liter on Manhole A and 50 milligrams per liter on Manhole B. These can be multiplied by the flows to obtain the mass flow of SF1 at each manhole, for use in further calculations.
Multiplying liters per second by milligrams per liter yields milligrams per second.
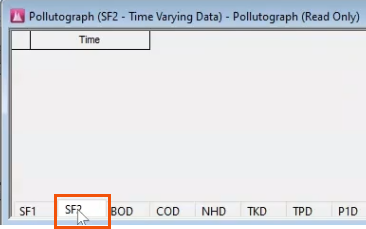
- Select the SF2 tab to see that there is no Sediment Fraction 2. This tab is blank.
Dissolved pollutants
These pollutants always end in the letter D on the Pollutograph tabs. For example:
- P1D is pollutant 1 dissolved.
- BOD normally stands for biochemical oxygen demand, but here, it stands for BOD dissolved.
- COD stands for chemical oxygen demand dissolved.
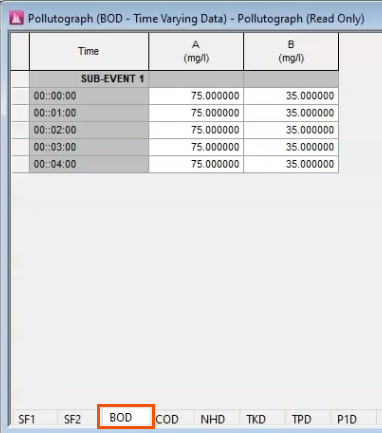
- Select the BOD tab to see that Manhole A is assigned 75 mg/l and Manhole B is assigned 35 mg/l.
Attached pollutants
These pollutants end in the letter A and are described in terms of potency. This example uses the one called BOA, which is actually BOD attached to the sediment fraction.
- Select the BOA tab.
In addition to entering the potency in kg/kg, it is crucial that you also define the node and sediment fraction that it is assigned to.
- Right-click one of the sub-events and select Profile Properties to assign the sediment fraction. Here, the sediment fraction is assigned to SF1.
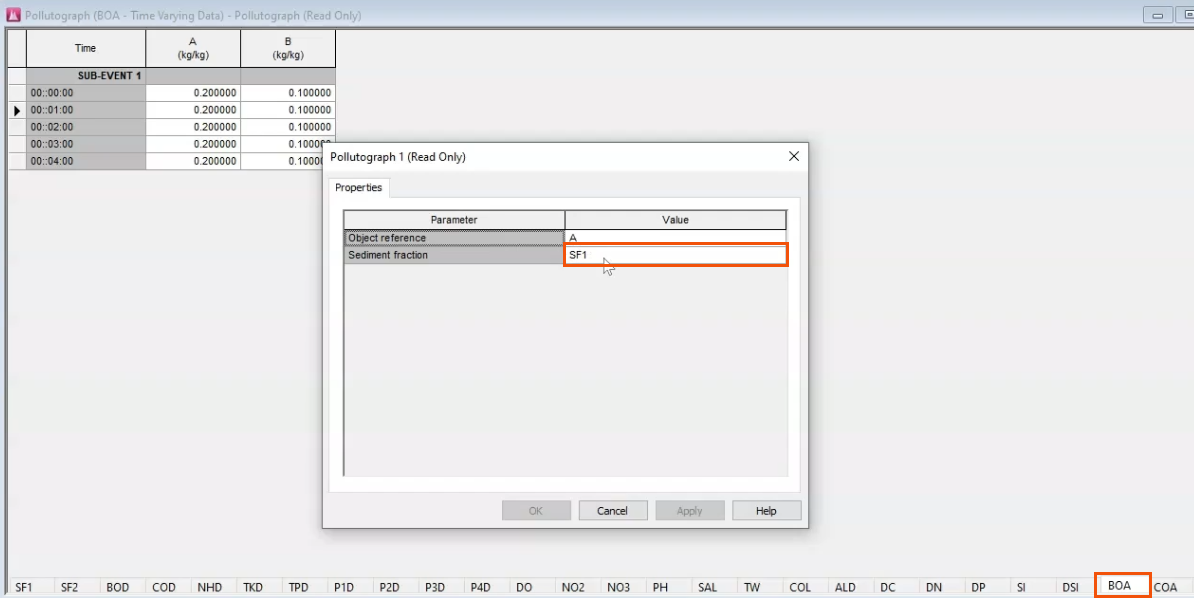
NOTE: Make sure to enter exactly “SF1”, as typing the number “1” is not sufficient.
- If using a second sediment fraction, define SF2 as well.
Detrital pollutants
The pollutants in this final category are used to calculate the growth and decay of algae and macrophytes. These determinants include things like temperature, acidity, and salinity.
On the respective tabs, you can define how they change with time.

Next, open the results in the GeoPlan and use the graphing tool to compare the results with the inflow hydrograph and the assigned pollutographs.
- On the Results toolbar, click Graph.
- In the GeoPlan, select Manhole A.
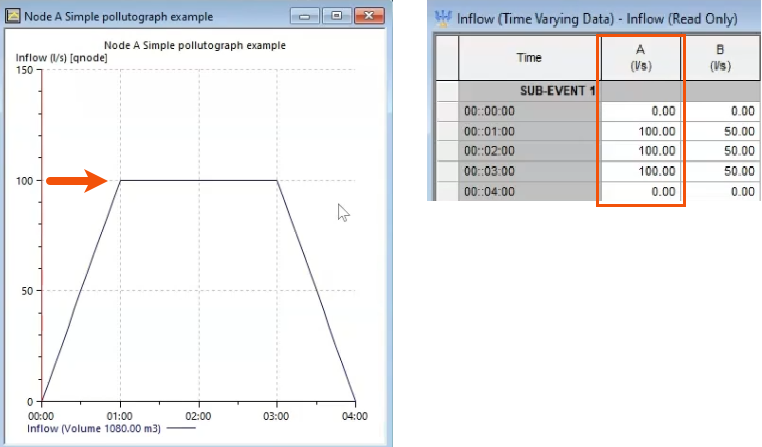
- In the Graph dialog, select Inflow (l/s).
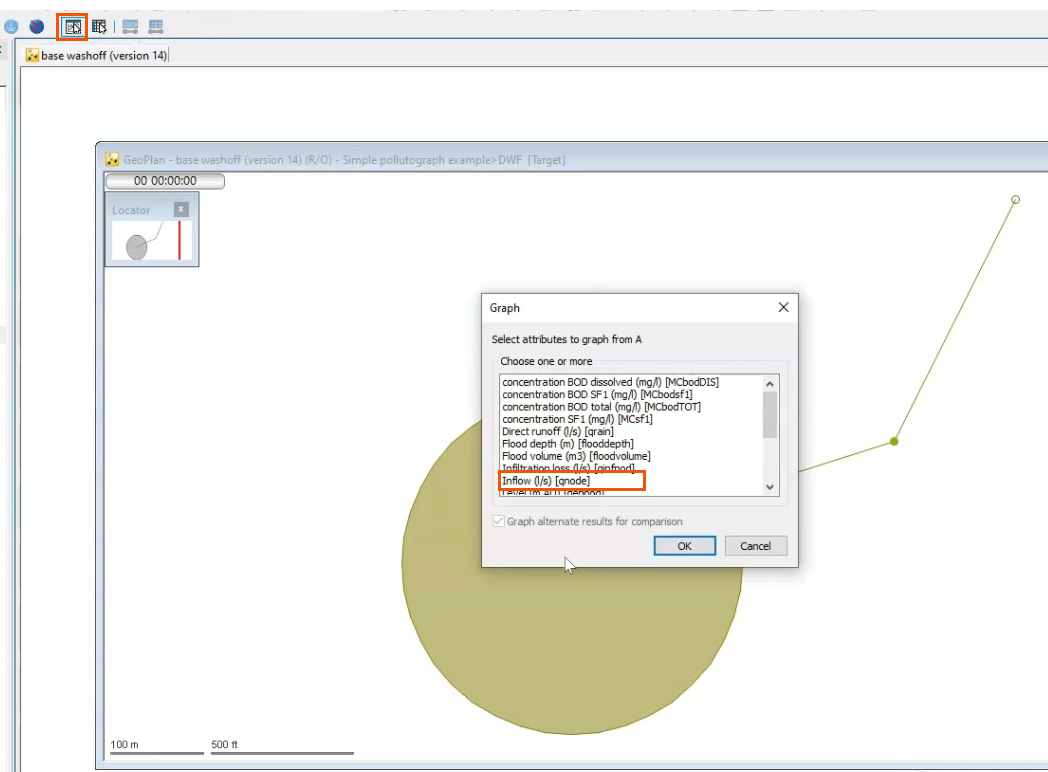
- Click OK.
The resulting graph matches the inflow hydrograph.
- For Manhole A, graph Mass inflow BOD dissolved (g/s) and Mass inflow BOD SF1 (g/s).
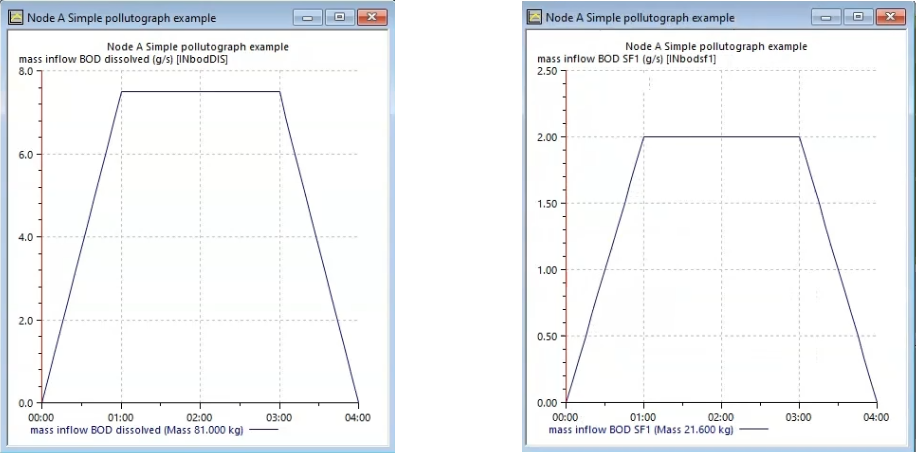
Calculations can be done manually to confirm that these values match the inflow pollutographs.
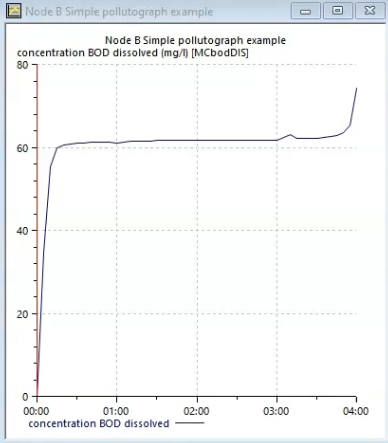
- Similarly, graph Concentration BOD dissolved (mg/l) to compare the value of 75 mg/l with the BOD tab of the pollutograph.
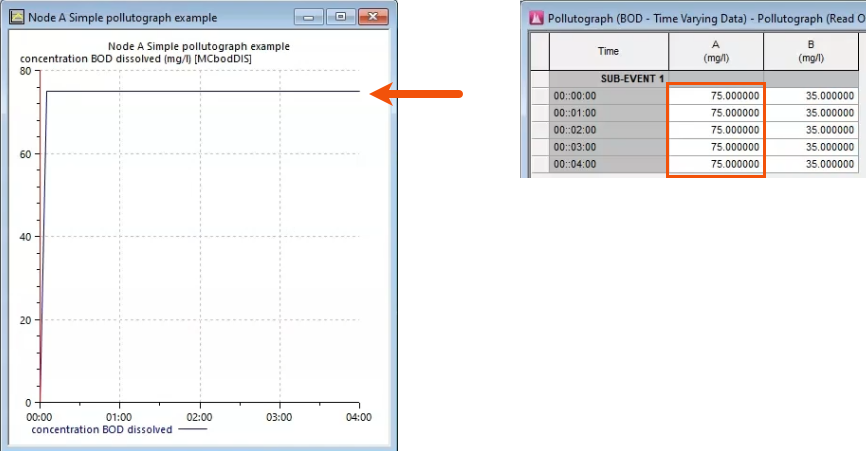
These checks are less obvious as you move further along a run. While the mass inflow BOD dissolved matches the input values at each manhole, some graphs will not match.
For example, when you graph the concentration of BOD dissolved, the equation divides the concentration by the total flow, instead of by the inflow to that manhole. This means that the result may not have the shape or values expected.